Garcia 2007b

Performance0-Rank  0-Score1-Rank  1-Score2-Rank  2-Score3-Rank  3-Score3R-Rank  3R-Score4-Rank  4-Score  NED
Afanassiev 2001   52  0.4020  0.0027  0.0523  0.2175  0.0336  0.08
Anderszewski 2003   13  0.5081  0.0013  0.0721  0.2236  0.1311  0.17
Ashkenazy 1981   11  0.5084  0.0041  0.0535  0.1367  0.0347  0.06
Bacha 2000   49  0.418  0.0136  0.0442  0.0954  0.0638  0.07
Badura 1965   74  0.3052  0.0078  0.0379  0.0383  0.0289  0.02
Barbosa 1983   84  0.2385  0.0082  0.0381  0.0374  0.0479  0.03
Biret 1990   6  0.5369  0.0011  0.088  0.3468  0.0516  0.13
Blet 2003   51  0.4013  0.0147  0.0551  0.0572  0.0363  0.04
Block 1995   68  0.3537  0.0020  0.0530  0.1745  0.0531  0.09
Blumental 1952   21  0.4748  0.0019  0.0517  0.2524  0.216  0.23
Boshniakovich 1969   10  0.5032  0.0040  0.0531  0.1563  0.0437  0.08
Brailowsky 1960   20  0.4823  0.0024  0.0534  0.1358  0.0535  0.08
Bunin 1987   56  0.3953  0.0062  0.0463  0.0461  0.0467  0.04
Bunin 1987b   57  0.3824  0.0061  0.0460  0.0467  0.0460  0.04
Chiu 1999   41  0.4341  0.0071  0.0549  0.0574  0.0356  0.04
Cohen 1997   77  0.2942  0.0077  0.0378  0.0349  0.0666  0.04
Cortot 1951   31  0.4544  0.0031  0.0529  0.1738  0.1712  0.17
Csalog 1996   87  0.1628  0.0087  0.0376  0.0378  0.0381  0.03
Czerny 1949   54  0.3960  0.0018  0.0516  0.2548  0.0618  0.12
Czerny 1990   55  0.3983  0.0058  0.0552  0.0580  0.0369  0.04
Duchoud 2007   44  0.4218  0.0153  0.0373  0.0355  0.0483  0.03
Ezaki 2006   42  0.4289  0.0068  0.0472  0.0476  0.0371  0.03
Falvay 1989   81  0.2651  0.0085  0.0285  0.0280  0.0475  0.03
Farrell 1958   9  0.512  0.122  0.234  0.5113  0.362  0.43
Ferenczy 1958   46  0.4154  0.0035  0.0532  0.1434  0.1613  0.15
Fliere 1977   18  0.4973  0.0033  0.0618  0.2483  0.0334  0.08
Fou 1978   23  0.4627  0.0051  0.0550  0.0571  0.0458  0.04
Francois 1956   75  0.3063  0.0059  0.0548  0.0581  0.0370  0.04
Friedman 1923   33  0.4536  0.0054  0.0374  0.0330  0.2732  0.09
Friedman 1923b   36  0.4425  0.0055  0.0646  0.0632  0.2620  0.12
Friedman 1930   26  0.4661  0.0052  0.0465  0.0444  0.1241  0.07
Garcia 2007   1  0.721  0.641  0.631  0.811  0.841  0.82
Garcia 2007b   target  targettarget  targettarget  targettarget  targettarget  targettarget  target
Gierzod 1998   16  0.4955  0.0014  0.077  0.3858  0.0419  0.12
Gornostaeva 1994   27  0.4547  0.0048  0.0553  0.0561  0.0468  0.04
Groot 1988   73  0.3235  0.0021  0.0627  0.1882  0.0342  0.07
Harasiewicz 1955   19  0.496  0.0143  0.0540  0.1073  0.0354  0.05
Hatto 1993   22  0.4678  0.0042  0.0633  0.1456  0.0443  0.07
Hatto 1997   30  0.4577  0.0044  0.0541  0.1078  0.0352  0.05
Horowitz 1949   53  0.4034  0.0064  0.0471  0.0456  0.0461  0.04
Indjic 1988   29  0.4582  0.0045  0.0745  0.0773  0.0451  0.05
Kapell 1951   34  0.4539  0.009  0.0611  0.3153  0.0517  0.12
Kissin 1993   67  0.3674  0.0072  0.0462  0.0486  0.0378  0.03
Kushner 1989   25  0.4614  0.0115  0.0714  0.2660  0.0521  0.11
Luisada 1991   2  0.5817  0.015  0.136  0.3934  0.205  0.28
Lushtak 2004   35  0.4486  0.0050  0.0558  0.0581  0.0364  0.04
Malcuzynski 1961   61  0.3764  0.0065  0.0470  0.0477  0.0376  0.03
Magaloff 1978   66  0.3668  0.0066  0.0466  0.0480  0.0374  0.03
Magin 1975   12  0.507  0.017  0.1112  0.2738  0.147  0.19
Michalowski 1933   3  0.5522  0.004  0.165  0.4424  0.363  0.40
Milkina 1970   63  0.3788  0.0060  0.0557  0.0577  0.0459  0.04
Mohovich 1999   40  0.4371  0.0049  0.0554  0.0577  0.0365  0.04
Moravec 1969   85  0.2250  0.0083  0.0283  0.0250  0.0472  0.03
Morozova 2008   8  0.5272  0.0016  0.0625  0.1957  0.0429  0.09
Neighaus 1950   4  0.5416  0.016  0.123  0.5447  0.079  0.19
Niedzielski 1931   72  0.3326  0.0028  0.0520  0.2238  0.1410  0.18
Ohlsson 1999   15  0.4957  0.0034  0.0526  0.1960  0.0428  0.09
Osinska 1989   38  0.435  0.0117  0.0519  0.2257  0.0427  0.09
Pachmann 1927   83  0.243  0.0286  0.0287  0.0284  0.0388  0.02
Paderewski 1930   58  0.3856  0.0038  0.0544  0.0941  0.1125  0.10
Perlemuter 1992   32  0.4570  0.008  0.0610  0.3249  0.0514  0.13
Pierdomenico 2008   39  0.4310  0.0157  0.0555  0.0554  0.0550  0.05
Poblocka 1999   48  0.4165  0.0037  0.0437  0.1368  0.0439  0.07
Rabcewiczowa 1932   24  0.4687  0.0046  0.0547  0.0570  0.0357  0.04
Rachmaninoff 1923   43  0.4246  0.0030  0.0543  0.0970  0.0444  0.06
Rangell 2001   71  0.3343  0.0069  0.0469  0.0483  0.0385  0.03
Richter 1976   82  0.2640  0.0079  0.0377  0.0357  0.0562  0.04
Rosen 1989   7  0.5315  0.0112  0.079  0.3442  0.118  0.19
Rosenthal 1930   76  0.2949  0.0075  0.0467  0.0477  0.0384  0.03
Rosenthal 1931   69  0.3467  0.0073  0.0375  0.0352  0.0480  0.03
Rosenthal 1931b   64  0.3730  0.0070  0.0556  0.0552  0.0555  0.05
Rosenthal 1931c   80  0.2779  0.0076  0.0382  0.0374  0.0386  0.03
Rosenthal 1931d   70  0.3376  0.0074  0.0464  0.0444  0.0848  0.06
Rossi 2007   60  0.3831  0.0063  0.0468  0.0452  0.0649  0.05
Rubinstein 1939   62  0.379  0.0167  0.0461  0.0434  0.2324  0.10
Rubinstein 1952   86  0.2133  0.0084  0.0380  0.0368  0.0487  0.03
Rubinstein 1966   79  0.2790  0.0081  0.0284  0.0267  0.0482  0.03
Schilhawsky 1960   50  0.4012  0.0122  0.0724  0.2050  0.0623  0.11
Shebanova 2002   28  0.4545  0.0010  0.0615  0.2580  0.0330  0.09
Smith 1975   17  0.4975  0.0039  0.0338  0.1280  0.0345  0.06
Sokolov 2002   47  0.4180  0.0056  0.0459  0.0467  0.0373  0.03
Sztompka 1959   5  0.5411  0.013  0.172  0.5538  0.214  0.34
Tomsic 1995   78  0.2966  0.0080  0.0286  0.0270  0.0477  0.03
Uninsky 1932   14  0.4919  0.0032  0.0613  0.2646  0.0715  0.13
Uninsky 1971   45  0.4221  0.0029  0.0522  0.2259  0.0622  0.11
Wasowski 1980   37  0.4438  0.0023  0.0628  0.1873  0.0433  0.08
Zak 1937   59  0.384  0.0125  0.0536  0.1381  0.0346  0.06
Zak 1951   65  0.3629  0.0026  0.0539  0.1174  0.0440  0.07
Random 1   89  -0.0859  0.0088  0.0288  0.0210  0.4626  0.10
Random 2   90  -0.1858  0.0090  0.0190  0.0182  0.0290  0.01
Random 3   88  0.0162  0.0089  0.0189  0.0118  0.2853  0.05

Note: To load data table give above into Excel, copy and paste the data into a text editor (such as WordPad) first, then copy the text in the editor and past into Excel. You should remove the "target" line from the data before pasting into Excel so that plotting graphs of the data is done properly.

Column descriptions

  • Performance:
  • 0-Rank/0-Score: 0-Score is equivalent to Pearson correlation of the entire data sequence between the reference performance and a test performance. 0-Rank is the sorting order of the 0-scores (highest score has a rank of 1).
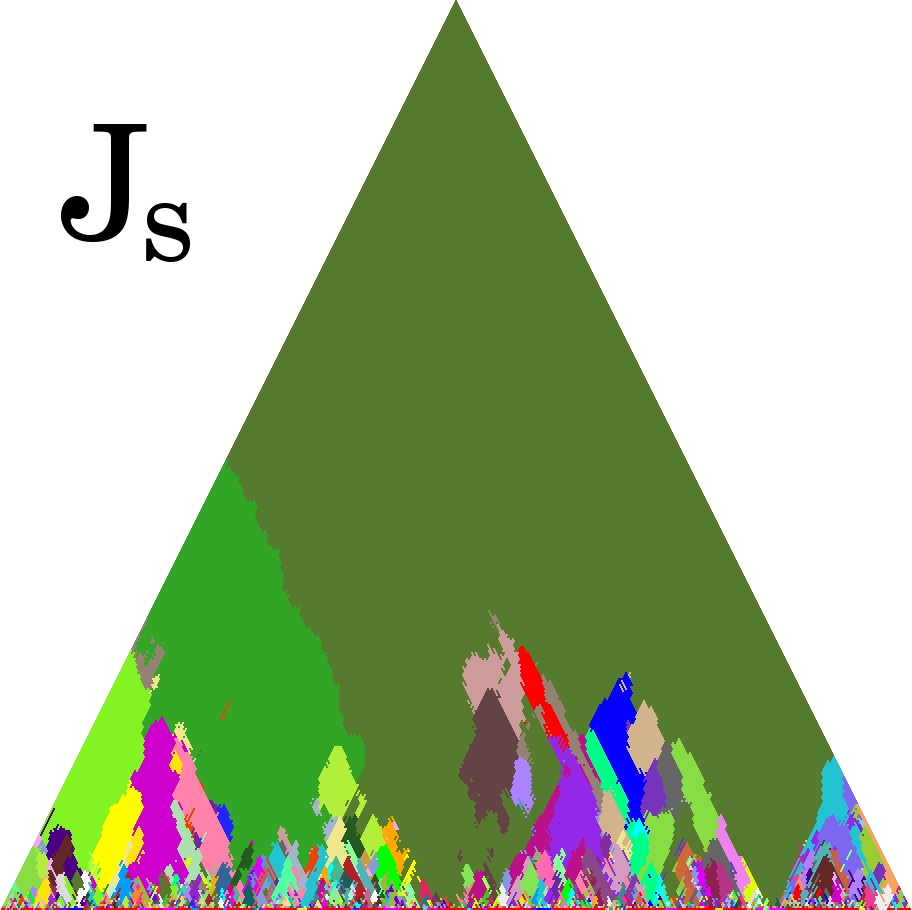
  • 1-Rank/1-Score: 1-Score is the area fraction covered by a particular performance in the scape plot (see image above). These values should not be taken literally, since they are sensitive to the Hatto Effect.
  • 2-Rank/2-Score: 2-Score values are equivalent to 1-Score values with all higher-ranking performances removed before the calculation of the area of coverage in the scape is calculated. Improvment over the 1-Rank scores, but still somewhat sensitive to the Hatto Effect.
  • 3-Rank/3-Score: Similar to 2-Rank calculations. The bottom 1/2 of the 2-rank performances are kept constant as a noise floor for the similarity measurement. Then one-by-one the top 1/2 of the 2-rank performances are superimposed with the noise-floor performances, and a 3-score is measured as the area covered in the scape. This measure is not sentisive to the Hatto Effect.
  • 3R-Rank/3R-Score: Reverse 3-rank/3-scores. 3-rankings and scores are not symmetric (A->B values are different from B->A values). So this column represents similarity measures in the opposite direction.
  • 4-Rank/4-Score: The geometric mean between 3-scores and 3R-scores. This column gives the best overall similarity ranking between the various performances (see color codes below).
  • NED: Noise Equivalient Distance (not yet implemented)

Color codes for 3-rank listings:

  • red = strongly similar performance to target
  • orange = moderately similar performance
  • yellow = weakly similar performance
  • green = marginally similar/dissimilar performance
  • white = dissimilar to target
  • blue = false positive (has high 3-rank score but low 3R-rank score)

3-rank/scores are not symmetric, so the 3R-rank/score columns give the 3-rank/scores going in the opposite direction. More matches in the 3-rank column than in the 3R-rank column indicates an individualistic performance, while more matches in the 3R-rank column indicates a mainstream performance.

If a 3-rank and a 3R-rank are both marked as similar to each other, then there is a possible direct relation between the performances. If one is similar to the other but not in the reverse direction, then the similarity is more likely to be by chance (performers randomly chose a similar interpretation).